The Four Sources of Cross-Border Cost
Part IV · Cross-Border and Regional Clearing Rails (Chapters 13–19) Builds on: Chapter 10 (the prefunded pool), Chapter 13 (correspondent banking, multi-hop fees) New concepts in this chapter: mid-market rate, FX spread, prefunded liquidity cost, compliance cost, corridor
This chapter is the key prerequisite for understanding what stablecoins are worth. When the course reaches what stablecoins solve, it will hold them up against these four items, one by one.
1. Back to the Remittance That Lost 7.4%
All three clearing-rail ledgers are now open; back to the cross-border remittance that has been left hanging. In the remittance from the chapter on no global central bank, $1,000 arrived as 926 — 7.4% gone. The four-hop table listed just four fees and one spread, but the real cost structure is more complicated than that, and the biggest item is one the payer never sees.
This chapter breaks the cost into four items and, for each, pins down who bears it and whether it can be seen.
2. The Four Costs at a Glance
| Cost item | Who fronts it on this payment | How it reaches the user | Visible to the payer? | Size |
|---|---|---|---|---|
| FX spread | The user | Deducted straight from this payment | No | 0.5%–3% of the amount sent |
| Intermediary fees | The user, or the payee | Deducted straight from this payment | Partly | $10–25 per hop, two to four hops |
| Prefunded liquidity | The remittance operator | Spread into overall pricing, shared out across every user | Not at all | Not priced per payment — scales with countries covered |
| Compliance review | The remittance operator | Spread into overall pricing, plus a cost paid in time | No | Not priced per payment — shows up as 1–5 days of delay |
The second column is easy to misread, so let's settle it now: all four costs are ultimately borne by the user.
Operators are not charities. The opportunity cost of money sitting prefunded, the salaries of a compliance team — both go into overall pricing, and the user still pays for them in the end, through the rate and the spread. So the real dividing line is not who bears it but how it gets passed through:
| The first two | The last two | |
|---|---|---|
| How they're priced | Per payment | Not per payment |
| Who they land on | The user making this exact payment | Every user of that operator |
| On a single statement | Findable, even when buried in the rate | Never findable |
This is the same structure as the point in interchange: the 2% taken off the merchant goes into the shelf price and is paid by every customer — including the ones paying cash, who get no rewards at all. A cost does not vanish because the statement never names it; it is only shared out a different way.
Items one and three are this chapter's focus. Item one is where users lose the most; item three is the heaviest burden on the industry itself.
3. FX Spread: The Biggest Hidden Cost
Two definitions first:
- Mid-market rate: the midpoint between bid and ask in the interbank market — the rate a search engine shows you. It is a reference price. Individuals never get it.
- Spread: the gap between the rate an institution gives you and the mid-market rate.
A worked example. Say the mid-market rate is 1 dollar = 56.00 pesos:
| Channel | Rate offered | Spread | What $1,000 converts to |
|---|---|---|---|
| Mid-market (reference) | 56.00 | 0% | 56,000 pesos |
| Bank | 54.32 | 3.0% | 54,320 pesos |
| Digital remittance platform | 55.72 | 0.5% | 55,720 pesos |
The bank hands over 1,400 pesos less than the platform — about $25.
(There is no standard spread; it varies by institution, currency, and amount. The remittance in the chapter on no global central bank used 2%, which falls between these two tiers; the two figures here exist only to show what "zero fees" really means.)
The key is the presentation. Plenty of channels advertise "zero fees," then put the entire profit into the spread. The user can't see the mid-market rate, and so has no way to judge how much was taken.
The only reliable way to judge any cross-border product's true cost: divide what the payee actually received by what the payer actually paid, then compare against the mid-market rate. The fee column tells you nothing.
You will use this method once more, later, when comparing the stablecoin path against the traditional one.
4. Intermediary Fees: The Price of Multiple Hops
The four-hop table in the chapter on no global central bank already showed it: four hops, a deduction at each. The previous chapter took apart the field that decides who bears those charges; here it just gets wired into the cost structure:
| Concept | What it means | Consequence |
|---|---|---|
| OUR / SHA / BEN | A field in the payment instruction naming who bears the charges. OUR: all on the payer; SHA: the payer covers the sending bank's leg, the rest comes out of the remitted amount (most common); BEN: everything comes out of the remitted amount | Under SHA or BEN, what the payee will actually receive cannot be known at sending time |
| Arrival amount uncertain | Intermediaries are entitled to deduct their fees straight from the principal | The payer sends 1,000; the payee may receive 970, with no way to announce it beforehand |
For business customers, "arrival amount uncertain" is fatal. A company pays a supplier $100,000 for goods; the supplier receives 99,850; the books don't match; the two sides burn several rounds of back-and-forth over $150. This is why so many cross-border B2B flows would rather use a channel that costs more but lands an exact amount.
5. Prefunded Liquidity: The Industry's Heaviest Burden
The payer never sees this item at all, but it decides whether a cross-border company can scale.
Back to the mechanism in the chapter on no global central bank: the Philippine bank needs a dollar account in New York, and that account has to hold money in advance for the bank to pay out the moment an instruction arrives.
A worked example. Say a remittance company wants to operate in 20 countries:
| Item | Value |
|---|---|
| Funds each country needs parked, to guarantee payout at any moment | $5 million |
| Countries | 20 |
| Total prefunded | $100 million |
| Opportunity cost of that money (at 5% a year) | $5 million per year |
In other words, this company pays $5 million a year for doing nothing — just for letting money sit in accounts across 20 countries.
Cross-check the logic: operating in just 1 country means $5 million parked and $250,000 of opportunity cost. Double the countries and this cost doubles — it grows linearly with coverage and has nothing to do with transaction volume. This is why cross-border companies always expand country coverage more slowly than it looks like they should.
Stack two more costs on top:
| Added cost | Where it comes from | What you do about it |
|---|---|---|
| FX risk | The money parked in the Philippines is pesos. If the peso weakens against the dollar, the balance shrinks in dollar terms | Hedge the FX — but hedging costs money; or shrink the peso pool, at the price of running dry more easily |
| Rebalancing cost | Money on a corridor (a specific send–receive country pair, like US to Philippines) usually flows one way: the US end keeps taking in dollars, the Philippine end keeps paying out pesos. A pool that only drains will hit bottom | Three ways to refill, next table — none of them free |
"Will hit bottom" is not an exaggeration. Workers in the US send money home; almost nothing flows the other way. So the peso pool doesn't oscillate — it falls monotonically. Refilling isn't an occasional mishap; it is a fixed expense of this business.
The three ways to refill:
| Refill | How it works | The price |
|---|---|---|
| Wire money over yourself | Take the correspondent chain from the chapter on no global central bank: convert dollars to pesos and send them into the pool | The refill is itself a cross-border payment — spread and intermediary fees apply as usual. Upside: it's bulk, at institutional rates, so unit cost is far below retail. Downside: one to five business days, so you must forecast days ahead |
| Borrow locally | Negotiate a peso credit line with a local Philippine bank; when the pool runs low, draw on it to cover payouts, repay later | Interest. And credit lines take collateral or long relationships to get — smaller operators may not land one |
| Find reverse flow | Win business from Philippine companies paying dollars outward; offset the two flows on your own books, and no money actually has to move | Reverse flow has to be found, and remittance corridors are structurally short of that direction. Find it and you save; fail and you fall back to the first two |
The third is the cheapest path. It is also the hardest.
Remember this entire section. When the next chapter covers Wise, you will see its whole model built on refill number three — and bottlenecked by refill number three. When the course reaches stablecoins, you will see that their single biggest claimed value is cutting away the prefunded-liquidity item.
This is the trade-off from clearing and settlement all over again: capital tied up vs. risk exposure. If users are to be paid instantly, someone has to park the money there first.
6. Compliance Cost: It Shows Up as Delay
A cross-border transaction passes three gates:
| Gate | What it does | What going wrong looks like |
|---|---|---|
| Sanctions screening | Match payer and payee names against national sanctions lists | A shared name or similar spelling gets held for manual review |
| Anti-money-laundering monitoring | Judge whether the transaction pattern looks suspicious | Large or high-frequency payments get paused |
| Local reporting | Some countries require a declared purpose and supporting documents | The user gets asked for more paperwork |
This cost never shows up as a fee. It shows up as time — a payment that could have finished same-day sits in a manual-review queue for three.
The product lesson: the gap in cross-border experience is often not technology, but how much an institution is willing to invest in lowering its false-block rate. Loosen the screening threshold a little and false blocks drop, the experience improves — and compliance risk rises. There is no standard answer to this trade-off.
7. Putting the Four Back into That $1,000
The user's direct losses on this transaction:
| Cost item | Amount (USD equivalent) | How it's computed | Share of 1,000 |
|---|---|---|---|
| Outbound, intermediary, and crediting fees | 55 | 25 + 15 + 10 + 5, per the four-hop table in the chapter on no global central bank | 5.5% |
| FX spread | 18.9 | A 2% spread applied to the 945 left after fees: 945 × 2% | 1.9% |
| Total | 73.9 | 55 + 18.9 | 7.4% |
Cross-check: 55 + 18.9 = 73.9, and 1000 − 73.9 = 926.1 — matching the arrival amount the four hops produced in the chapter on no global central bank.
The other two are fronted by the operator and never land on this one transaction — but they hide in different ways:
| Cost item | Why no single payment shows it | Who pays for it in the end |
|---|---|---|
| Prefunded liquidity | Spread into the operator's overall pricing; never itemized on any one payment | Every user of that operator, this one included |
| Compliance review | Not a deduction at all; it becomes 1–5 days of delay | The same, plus the extra days everyone waits |
The second table is the real point of this chapter. The 7.4% the user sees on this payment is only the part that breaks the surface; the two items underwater never appear on a single transaction, but users pay for them just the same — only shared out across everyone and every payment. They set this industry's pricing floor: anyone who wants to push rates below 1% has to get past these two.
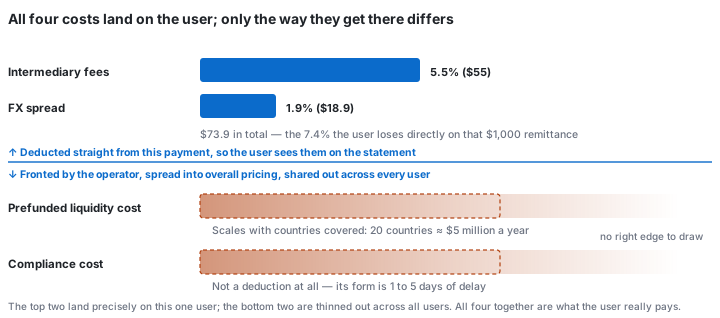
The two bars underwater are drawn without a right edge, and not to save effort — there simply is no "dollars per payment" number for them. One scales with the number of countries covered; the other isn't money at all, it's days.
But "no length to draw" does not mean "nothing to pay." The only difference between above and below the waterline is how the cost gets shared out: the top two land precisely on this one user, the bottom two are thinned out across every user. All four together are what the user really pays.
8. The Question This Chapter Leaves Open
Of the four costs, intermediary fees come from the hops. So the obvious thought: can you skip the correspondents?
The answer is yes. Companies have been doing it for over a decade, at rates far below the banks'.
The next chapter shows how they pull it off.
9. Self-check questions
- A platform advertises "zero-fee remittance." What is the one question you ask it to judge the true cost?
- A cross-border company expands from 10 countries to 20, with transaction volume unchanged. What happens to its prefunded liquidity cost? Explain what this does to expansion strategy.
- Why does compliance cost "show up as time" rather than as a fee?
10. Answers
Answer for yourself before reading on.
- Ask what exchange rate it gives, then compare against the mid-market rate. True cost = (mid-market − offered rate) ÷ mid-market + the explicit fee percentage. The fee column alone means nothing, since the whole profit can hide in the spread. Simpler still: just compare two numbers — "what I pay" and "what the other side receives."
- It doubles. Prefunded liquidity cost grows linearly with the number of countries and ignores volume. That means expanding into a tiny-volume country costs the same as a big one — so a cross-border company's country selection is a unit-economics problem, not a coverage race. It also explains why these companies usually start with a few big corridors instead of spreading wide.
- Because screening and review generate no extra outbound payment; what they consume is the institution's own staff and processing time. The institution folds that cost into its overall pricing, but on any single payment, what the user feels is not an extra deduction — it's money that keeps not arriving. This is also why "cross-border is slow" is so hard to fix by paying more: money can't shorten the sanctions-review queue.
Previous: Chapter 17 · UK Clearing Rails: Why One Market Grew Four Next: Chapter 19 · The Wise Model: Cross-Border Remittances That Never Cross a Border